Autodynamics’ Universal Gravitation
Application to Allais’ Anomaly
Carezani-Haye, Long Beach, CA July 10, 1999.
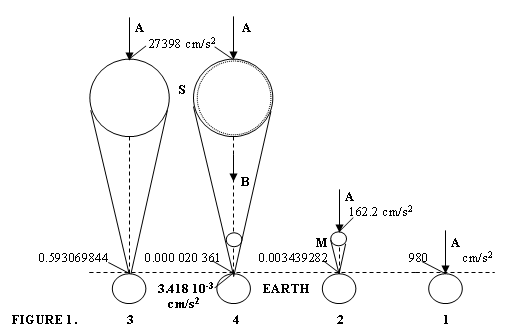
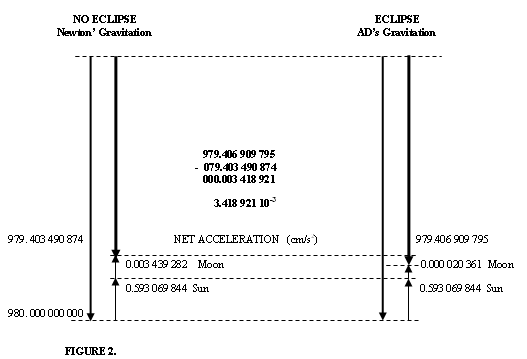
For AD Universal Gravitation, Pico-Gravitons from space (A) are absorbed by the Sun provoking a cone of penumbra and umbra where there is less Pico-Gravitons (B). When the Moon enters the penumbra and umbra, the normal gravitational acceleration that the Moon provokes on the Earth’s surface will decrease and consequently the net acceleration on the Earth’s surface will increase as is shown in Fig. 2. Neither Classical Mechanics nor General Relativity explains the phenomenon.

1.- Pico-Graviton quantity A on Earth produces 980 cm/s2.
2.- Pico-Graviton quantity A on Moon produces 162.2 cm/s2 and on Earth a decrease of 0.003439282 cm/s2.
3.- Pico-Graviton quantity A on Sun produces 27398 cm/s2 and on Earth a decrease 0.593069844 cm/s2.
4.- When the Moon is aligned with the Sun, the Pico-Graviton quantity received by the Moon will be B which is smaller than A.
If the Sun decreases the Earth acceleration of gravity by 0.593069844 cm/s2, the decreasing Pico-graviton quantity on the Moon will be in the same proportion as during the Eclipse.
27398 / 162.2 = 168.914 919 9 (a)
The Moon acceleration on Earth decreases in the same proportion:
0.003 439 282 / 168.914 919 9 = 0.000 020 361 cm/s2. (b)
Without the Eclipse, the decreasing acceleration on Earth is the sum of the Sun (3) and Moon’s (2) acceleration:
0.593069844 + 0.003439282 = 0.596509126 cm/s2. (c)
During the Total Eclipse (Maximum effect):
0.593 069 844 + 0.000 020 361 = 0.593 090 205 cm/s2. (d)
The expected decreasing acceleration is then:
0.596 509 126 ö 0.593 090 205 = 0.003 418 921 cm/s2. (e)
= 3.418 10-3 cm/s2
This means that during the Total Eclipse, the gravitational force on Earth increases by 3.418 10-3 cm/s2 with respect to its value before the eclipse. Foucault’s pendulum period decreases and the Torsion pendulum period increases.
Values and Graphical representation follow. (Not to scale).
No Eclipse:
980. 000 000 000
– 0. 593 069 844 Sun decreases
979. 406 930 156
– 0. 003 439 282 Moon decreases
979. 403 490 874 NE
Eclipse
980. 000 000 000
– 0.593 069 844 Sun decreases 979. 406 930 156
– 0. 000 020 361 Moon decrease
979. 406 909 795 E
E > NE
The net Gravitational Force in Earth increases and the Foucault Pendulum Period decreases.

Period CalculationThe Torsion Pendulum at Harvard is a Torus suspended by a thread (string). We know that its weight is 23.4 Kg.
Supposing that R = 0.5 m (3) I = 2.925 (4) Now it is possible to calculate the Constant Torsion
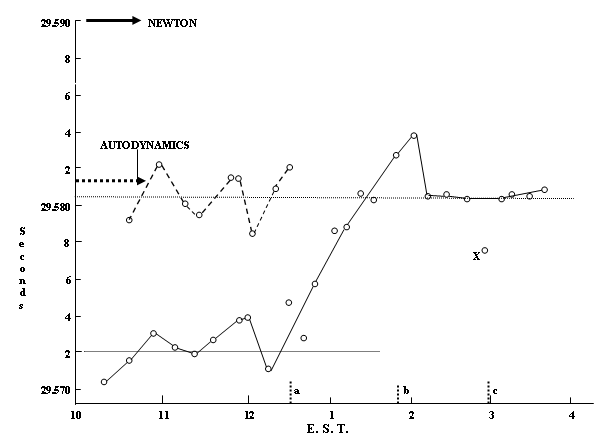
As point of reference we will take 29.572 s, that is the average Period before the Eclipse in Fig. 3, when the Gravitational Acceleration is the Newton Acceleration, that the pendulum needs to measure – to detect – if we are expecting to measure a different value during the Eclipse.
The Torus weight variation is given by a simple proportion (980.596 509 126 * 23.4) / 979. 403 490 874 = 23. 428 503 71 Kg. (7) It is now possible to calculate I using this weight.
This value is pointed out in Fig. 3 by and arrow. Repeating the same steps, (7) to (9), the AD values is calculated (980.021 746 179 * 23.4) / 979.403 490 874 = 23.414 771 41 Kg (10)
It is possible to see in Fig. 3 that this value corresponds to the 29.580 5 s measured at Harvard.. AD explains perfectly the phenomenon conceptually, that is QUALITATIVELY. The AD value of 3.418 10-3 is the smaller value expected by AD during the eclipse. For AD the phenomenon only happens when the Moon enters in the penumbra and especially in the umbra (Maximum value). This apparently is confirmed because the Sun and Moon are nearly aligned about once a month near the time of the new Moon and nothing was detected. The AD calculation is made without knowing the Pico-Graviton absorption by matter nor its cross section. It is true that B is smaller than A, but the total quantity in the Sun cone that is going through the Moon during the Eclipse is huge and this could change (currently unknown to us) the absorption coefficient by matter and/or its cross section. This could increase the AD value to match the value measured at Harvard.
Fig. 3. Times required to traverse the fixed part of the path of oscillation (ordinates) vs the hour at which the observations were made, from about 10 a. m. until nearly 4 p. m. (abscissas). The full line shows the observations made on 7 March 1970, the day of the total eclipse. The short vertical dashed lines, a, b, and c, show the times of onset, midpoint, and endpoint of the eclipse. The curved dashed line shows the data taken two weeks later, 21 March, when the sun and moon were on opposite sides of the earth. (Figure from Erwin J. Saxl and Mildred Allen, “1970 Solar Eclipse as ‘Seen’ by a Torsion Pendulum,” Phys. Rev. D3-4, 823(1971). The vertical lines given the deviation were omitted and given by the authors as an average of 2.5 10-2 %. The authors did not include Point X in the curve. |
 by the following equation:
 (1)
(1) (2) Where M = Weight and R the Torus Radius.
 (5)
(5) (6)
(6) (8)
(8) (9)
(9)
 (11)
(11) (12)
(12)